How Infographics Illustrate Completed Data through Graphics

It’s that time again for another design update. For those that are stopping by for the first time, I try and do a weekly article about design that will be useful everyday website owners and bloggers build a better site through design. Sometimes these articles are for beginners and sometimes they are for advances users, or they purely inspirational but all are useful and can help to build a better site.
Today, I want to talk about Infographics. Infographics are graphical representations of information. Designers use graphics along with complex data together to create an information graphic. By doing this you can quickly put a lot of information in an easy to read format for your readers.
You can find infographics almost anywhere. You can find them driving down the road, maps, statistical reports, and in the scientific world. For me, I use infographics when I creat content for articles and when I am brainstorming new design projects. Of course I never release them with my work, they are usually pencil drawn chicken scratch that I use to generate and build on an idea for the design and it gets trashed at the end of a project.
Infographic Examples
There are thousands of infographics available to us. Some them are inspirating and some of them are not. Today I gathered up seven of the best articles found on DesignGizer and The Web Blend. Within these lists you will find some of the best info-graphic examples created by designers from around the world.
1. 90 More Seriously Creative Infographics

I first came across this post back in July and was instantly addicted to infographics. You can find infographics that are 3D, complex, simple and even one about Apple. All of the infographics are impressive. Once you look at those, check out the original article 100 Seriously Creative Infographics.
2. 50 Informative and Well-Designed Infographics
This is another great list. Each one gives us a lot information in a small graphical package. Each and everyone of the listed information graphics were designed by knowledgeable and talented artists. So take a look at these, you won’t disappointed.
3. Transformation of data to visual!

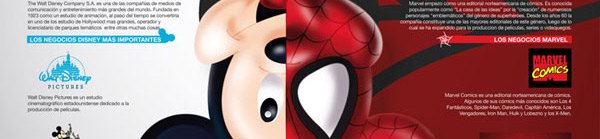
I came across this article over at The Web Blend bookmarking site a few months back. This has some interesting exmaples. They are well done and very very detailed. Out of the fifteen listed, my favorite two are the Google Social media Timeline and Facts About Facebook. I like these because, they stuck with the company color themes and used company / brand logos whenever they could. Both are easy to read and understand.
4. A Roundup of 25 Jaw-Dropping Infographics

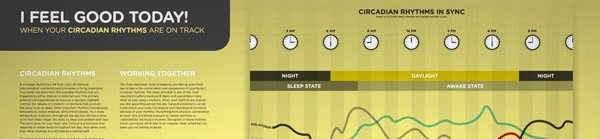
This roundup is has a lot of examples of statistics being used with graphics. The designers create their infographics using times and graphics to illustrate their data.
5. 30 Beautiful Infographics for your Inspiration

Here is another great list found on 1st Web Designer. This list gives more examples of stats and how every designer does the info-graphics differently. The examples in this showcase uses infographics that are about social media networks, opens source, and modern news events.
6. 60+ Beautiful Examples of Well-Designed Infographics
This list has got some cool examples. These example are great examples of illustration of data.
7. 10 of My Favorite Infographics

This last one I wrote and is a list of my favorite infographics. Instead of listing fifty plus images, I grabbed my favorite ones. I also go into detail about what infographics are and what is needed to create one.
Watch the State of the Internet
 Visual Content that Rules the Heart of Marketing
 5 Easy Ways To Impress More Of Your Website Visitors
 Add Structured Data Markup for Articles to your WordPress Blog
 Responsive Designs Boost Clients’ Morale
{ 17 Responses }